Table of content:
Introduction
The generation of nuclear energy is, from a financial/economic point of view, characterised by the high up-front costs (capital intensiveness) and the long duration (we use 60 years for our calculations) where constant dispatchable energy can be produced at very low marginal costs. Given the patience required, every private company will demand a clear commitment from the government. This usually will be difficult to make concrete, or in the case of guaranteed prices, will be very costly for the government/society. Many studies therefore arrive at high costs (i.e. inefficiency) for nuclear energy generation.
We believe that the Dutch government can provide commitment at relatively low cost by financing a large part of the initially required capital. Since the government is then "in it together", the private operator can be assured that the government will not change its mind halfway through (i.e. after 30 years!). From a societal point of view, such a commitment is desirable because of the CO2 reduction that, certainly in later years, will generate a great deal of welfare/wellbeing. After all, in the short term (10 years) we can still take major (efficient) steps with, for example, wind & solar energy, but in the medium/long term we also need an energy source that can deliver constantly & reliably. The costs in terms of emissions of the 'next best alternative' after nuclear (e.g. natural gas) will, in the long term, be so high that the (medium) long-term returns (in tCO2eq) more than make up for the initial capital investment, leading to a (very) positive overall societal return.
Below we work out an example for financing (part of) a power station with a capacity of one GW. This example is illustrative; all amounts can be multiplied proportionally for different capacities. We use government financing of €4.1 billion1 at an interest rate of 2.5%. For ease of interpretation, we are developing a social cost benefit analysis (SCBA) in a simplified setting in which the government lends the entire up-front capital to the operator and 'receives' CO2 reduction in return. The operator produces the energy, sells it on the market and repays the loan to the government. N.B. no price guarantees are issued, the (power) price risk therefore rests entirely with the operator. In practice, the financing will probably take a different form, but this approach provides a good estimate of the potential societal costs and benefits.
We first look at the costs of this loan for the government and then quantify the societal benefits. This leads to a (very) positive business case for society, with a societal return of 9.3% over a period of 65 years. Expressed in terms of today's CO2 prices, this implies a subsidy of (only) €5 per ton (far below the ETS and SDE ++ price). Finally, a sensitivity analysis shows that the business case remains (very) positive when assumptions/parameters change.
Societal costs: interest
In this simplified model, the costs for the government are (only) related to lending the capital to the operator. The government lends the money at an interest rate of 2.5% for a period of 55 years. In this stylised model, we assume that the construction of the (1GW) power station will start in 2026, at which point the entire €4.1 billion euro lump-sum will be financed. The plant will be productive in 2031; from this moment on, the interest is repaid (linearly) over 50 years. This leads to the following cash flows. N.B. we only show a selection of years in the table; the discount rate is explained later on.
| Year | Outstanding amount | Debt redemption | Interest rate | Discounting % |
|---|---|---|---|---|
| 2026 | 4100 | 0 | 0 | 100% |
| 2031 | 4546 | 93 | 114 | 100.4% |
| 2040 | 3711 | 93 | 93 | 76.4% |
| 2050 | 2783 | 93 | 70 | 42.4% |
| 2060 | 1856 | 93 | 46 | 20.6% |
| 2070 | 928 | 93 | 23 | 10.4% |
| 2080 | 0 | 93 | 0 | 6.1% |
| 2090 | 0 | 0 | 0 | 3.6% |
The State may be able to borrow at a rate lower than 2.5%, but on the market it could receive a higher return for a loan with comparable risk. In an economic sense, the costs are given by the difference between the market interest rate for a loan with such a risk and the 2.5% used here in our example.
To estimate the market return on such a loan (with comparable risk), we look at the interest that energy companies currently pay on their bonds2. Below are details on the corporate bonds of the 10 largest European energy companies3. For each company, the statistics listed are on the longest-dated bond for which data are publicly available4. Here we fit a simple quadratic function5 to arrive at the relevant yields per maturity (see Figure 1 below).
| Company | Coupon | Maturity | Price | Yield |
|---|---|---|---|---|
| Enel | 5.45% | 2070 | 98.96 | 5.47% |
| Iberdrola | 1.62% | 2031 | 111.32 | 0.55% |
| EDF | 5.25% | 2070 | 105.00 | 5.15% |
| National Grid | 0.55% | 2029 | 100.43 | 0.5% |
| Engie | 1.38% | 2025 | 105.21 | 0.11% |
| Orsted | 5.75% | 2040 | 163.76 | 3.15% |
| Endesa | NA% | NA | NA | NA% |
| Innogy | 5.75% | 2033 | 159.85 | 1.84% |
| E.ON | 0.35% | 2030 | 99.21 | 0.44% |
| Fortum Oyj | 2.13% | 2029 | 111.58 | 0.76% |
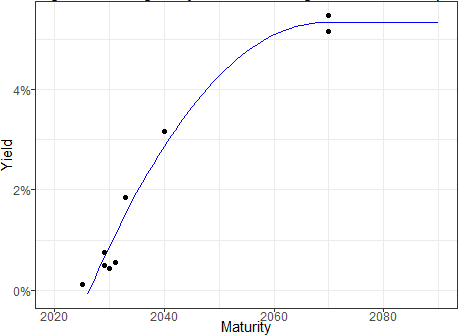
The long-term interest rate is 5.33%, so for the long-term outstanding financing, the state receives 5.33% - 2.5% = 2.83% less than it would receive in the market. Using the above curve, we can determine a discount rate (already shown in Table 1) and determine the present value of the interest & repayments at a market rate of interest. This turns out to be 1,627 and 1,841 million respectively. Since the government lends out €4.1 billion, the (present value of the) societal costs are 4100 - 1627 - 1841 = 632 million.
Societal benefits: CO2 reduction
The greatest societal benefit from a nuclear power plant is obviously in the fact that nuclear energy is produced CO2-free6. Nuclear energy currently is also the only CO2-free energy source that can deliver consistently (day & night) and will therefore have to be a marginal part of the energy mix in the long term7. Society thus receives a CO2 reduction compared to the 'next best' consistent supplier (natural gas). Generation from gas releases 410 tCO2eq/GWh (IPCC 20148, minimum lifecycle emission), which implies a reduction of 398 ton per GWh for nuclear.
At a capacity of 90%9, 1GW capacity delivers an annual production of 7,900GWh, which corresponds to a CO2 reduction of 3.1 million tons per year. In the next section, we consider the economic value of this reduction.
Societal benefits of a (future) tonne of CO2 reduction
As mentioned earlier, patience is key when it comes to (financing) a nuclear power plant. Given the (very) long lifespan of a nuclear reactor (we use 60 years for our calculations), for a SCBA a projection must be made of the future costs of CO2 (or equivalently: benefits of CO2 reduction). The Netherlands are currently working hard to pick the 'low-hanging fruit', so the costs of CO2 reduction are still limited. Given the target in the Dutch National Climate Agreement, however, these will increase very sharply once all that low-hanging fruit has been harvested. Aalbers et al. (2016)10 made a forecast in a CPB/PBL study for the development of the 'efficient CO2 price', i.e. the lowest marginal (prevention) costs of CO2, if the most efficient policy is pursued. They come to the following prices:
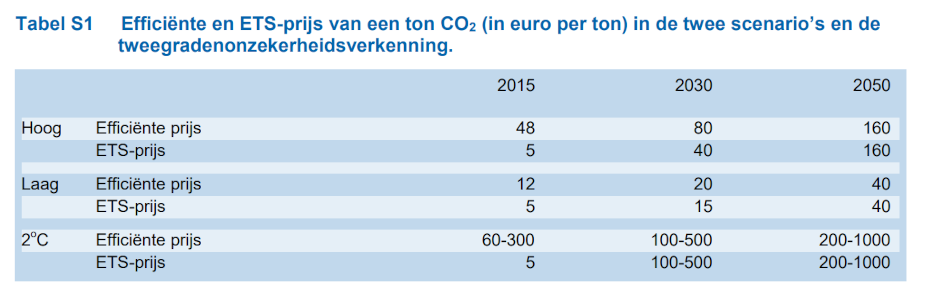
Table S1 (p.5) from Aalbers et al. (2016)
The High scenario calculates with a 65% (40%) reduction by 2050 (2030) - after all, the National Climate Agreement had not yet been signed in 2016. The 2°C scenario is based on an 80% reduction by 2050. Given that the National Climate Agreement calculates with 95%, the most extreme scenario from this study is less extreme than the (Dutch) reality. Please also note that at the time of writing (February 2021) the ETS price is already at around €40 and is subsidised from about €70 per ton via the SDE++ scheme.
In a more recent study, Van Wijnbergen et al. (2020) 11 arrive at the following prices for the 'societal cost of carbon'. In this analysis we use the "baseline" model (blue line) of this study. Note that this price is a (very) conservative assumption. For example, a model is used in which emissions are not equal to zero until around 2115 - the model is global, not just EU/NL. Given the ambitions in the National Climate Agreement, the costs for the Netherlands will be substantially higher, as demonstrated by the estimates from Aalbers et al. (2016).
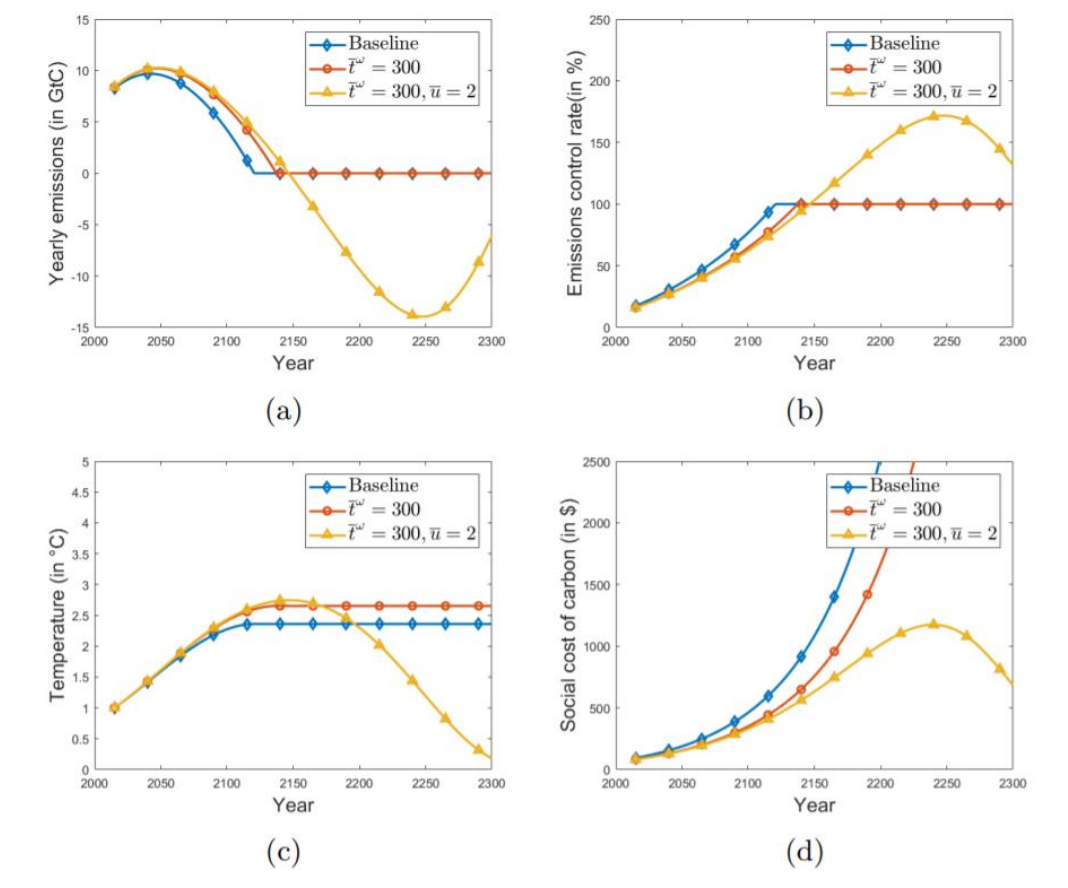
Figuur 1 (p. 11) from Van Wijnbergen et al. (2020)
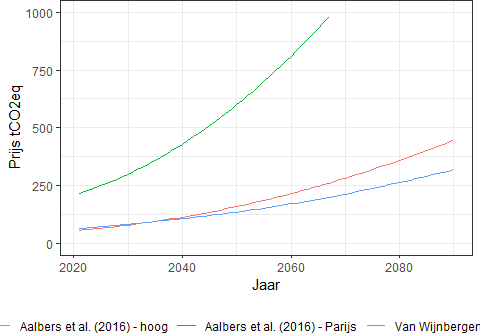
Below we show the three graphs in the same plot for the relevant period (up to and including 2090). For the following calculations we use the estimates of Van Wijnbergen et al. (2020), which are conservative (low) given the Dutch situation.
Value of future reduction
By multiplying the above prices by the annual CO2 reduction (3.1 million tons), we obtain the societal benefits of the nuclear power plant. In our stylised model, the proceeds go directly to the government, so we can add (its value) to the repayments and interest. This brings us to the graph below:
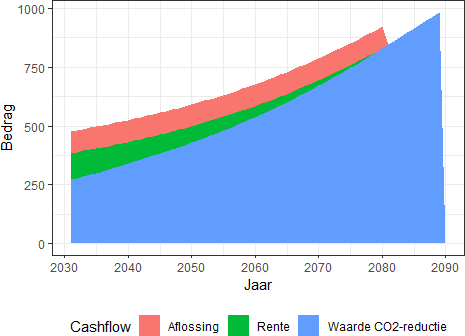
This graph immediately illustrates where the big gains are in nuclear energy: CO2 reduction in the (very) long term (when the price of CO2 is high). The present value of the future CO2 reduction is 8140 million, which brings the total societal welfare gain to 8140 - 632 = 7508 million. This corresponds to a societal return of 9.3% per year (for more than 60 years).
Alternatively, one can calculate backwards to obtain the CO2 ton price of 2021. If all future CO2 prices are reduced by a factor of 13, the government will have a break-even situation (societal costs = societal benefits). Van Wijnbergen et al. (2020) are calculating for 2021 with a ton price of €65. Translated to today's CO2 prices, this implies a price of (only) €5 per ton.
Societal benefits: other remaining
On the benefit side, the SCBA mainly revolves around CO2 reduction. Additional (societal) benefits include job creation, more limited energy dependence on "undesirable" countries (Uranium can be procured/stored on a large scale) and know-how that can be useful in future developments. For example, Deloitte (2019)12 calculates that a nuclear capacity of 1GW will lead to an increase of approximately €3 billion GDP and approximately 6,000 jobs. Given the many assumptions involved in determining the added societal value and the limited magnitude of this effect (compared to the benefits in terms of CO2 reduction), we have omitted these matters from our calculation.
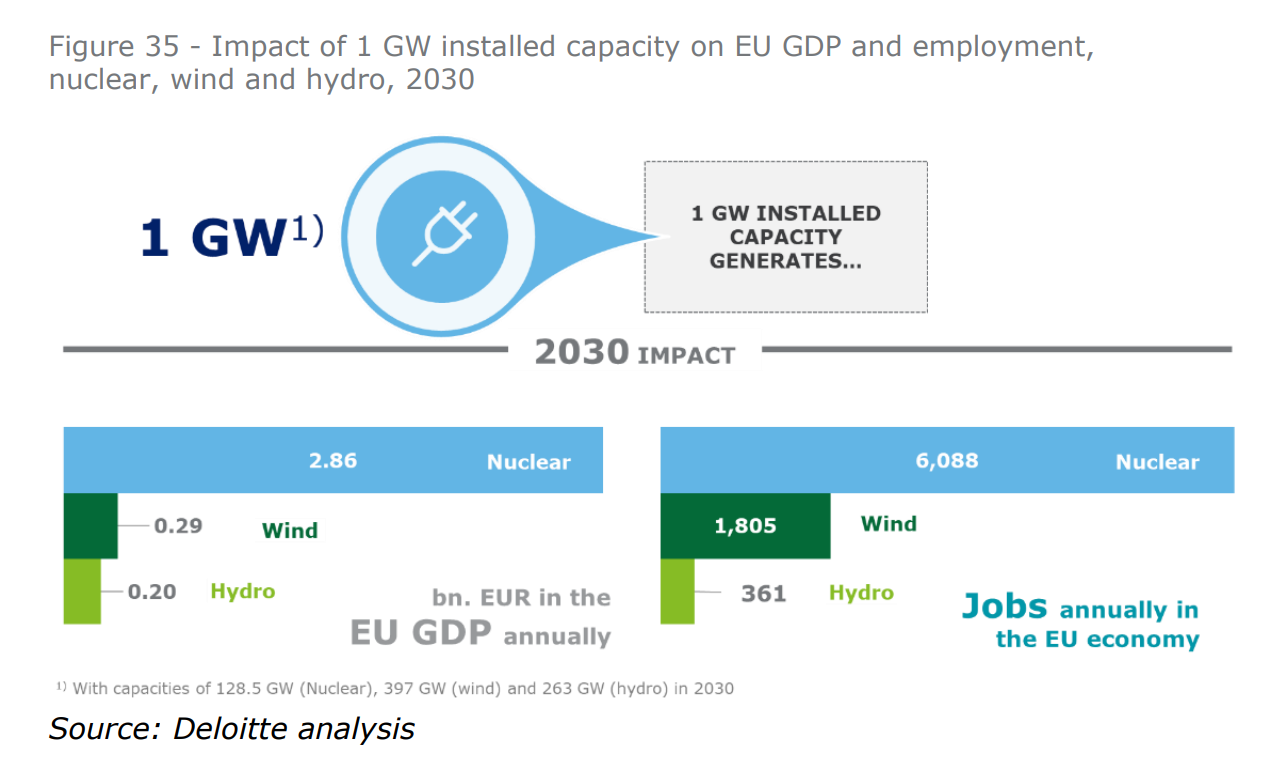
Figure 35 (p. 48) from Deloitte (2019)
Sensitivity analysis
In this analysis we had to make a (considerable) number of assumptions. to the best of our knowledge, we have used the most accurate estimate where possible and used a conservative estimate (disfavouring nuclear) where there is a lot of uncertainty (such as with future CO2 prices). The analysis & formulae can be shared and (re)calculated for other assumptions upon request. The table below shows the SCBA results for significant changes in parameters/assumptions.
The table shows that, from a societal point of view, the construction of a nuclear power plant (still) produces substantial welfare gains with every change and thus forms a positive "business case" for society: the societal return is at least 5.5%. In terms of current CO2 prices, the implicit subsidy is a maximum of €19 per ton, far below the current ETS & SDE ++ prices13.
| Setting | Welfare Gains (M) | Societal return | Current CO2-price |
|---|---|---|---|
| Baseline | 7508 | 9.3% | 5.1 |
| Biomass instead of natural gas as ‘next best alternative’ | 1781 | 5.5% | 17.1 |
| More efficient ‘next best alternative’14 | 3410 | 6.9% | 10.2 |
| Hight cost (€6 miljard) | 7214 | 7.8% | 7.4 |
| Construction delay (to 10 years) | 5873 | 7.8% | 10.0 |
| (50%) lower CO2-price | 3438 | 6.8% | 5.1 |
| CO2-prices according to Aalberts et al. (2016) - Paris | 34400 | 17.9% | 3.9 |
| CO2-prices according to Aalberts et al. (2016) - high | 8710 | 9.7% | 3.9 |
| (2%) higher market interest rates for energy companies | 3805 | 9.3% | 18.9 |
| Shorter lifespan (40 jaar) | 6388 | 9% | 6.6 |
| Longer lifespan (80 jaar) | 8036 | 9.4% | 4.8 |
- ^ See also numbers earlier in this white paper. The sensitivity analysis explicitly looks at higher costs (6 billion). Estimate from European Commission (2016), “Nuclear Illustrative Program presented under Article 40 of the Euratom Treaty for the opinion of the European Economic and Social Committee”, pp. 11. (link to EC site)
- ^ Although in a stand-alone setting the financing of nuclear energy would require a higher interest rate (than "general energy") due to the higher risk, this is no longer the case in this setting: the main risk (i.e. political) is eliminated because the government commits itself through the financing.
- ^ Based on market capitalisation(s) in 2019. List includes both electric (only) utilities and multi-utilities.
- ^ Enel & EDF have issued a perpetual bond (indicated with year 2070), we have not been able to find data on bonds for Endesa.
- ^ With the restriction that the yield curve is non-declining, i.e. constant on a long-term yield.
- ^ Nearly, 12 tCO2eq/GWh according to IPCC 2014 (reference in footnote 7)
- ^ From an economic perspective, only the marginal contribution can/should be considered for an efficiency analysis
- ^ Schlömer, Steffen et al. (2014), “IPCC Working Group III - Mitigation of Climate Change, Annex III: Technology - specific cost and performance parameters - Table A. III.2 (Emissions of selected electricity supply technologies (gCO2eq/kWh ))”, p.p. 1335. link to IPCC WG3
- ^ Based on Borssele's capacity.
- ^ Aalbers, Rob, Gusta Renes en Gerbert Romijn (2016), "WLO-klimaatscenario’s en de waardering van CO2-uitstoot in MKBA’s," CPB/PBL background document. link to CPB/PBL
- ^ Van Wijnbergen, Sweder, Rick van der Ploeg & Stan Olijslagers (2020), "Commit to a credible path of rising CO2 prices", Tinbergen Institute, Discussion Paper. link to Tinbergen Institute Discussion Papers
- ^ Deloitte (2019), “Economic and social impact report”. link to FORATOM study
- ^ The SDE ++ prices cannot really be compared one-to-one; for SDE ++, the same price is charged for current & future CO2 reduction, while we take future price increases into account here. The comparison can however be made with ETS.
- ^ The emissions of the next best alternative will drop from 410 to 50 gCO2eq/kWh in 50 years